Jul 11, 2018 | Baseball, Guest Posts, Partners
If you can’t explain it ‘simply’ then you don’t understand it well enough. – Albert Einstein
This statement holds true in the world of hitting, more today than ever. New ways to measure virtually every aspect of the art of hitting a round ball with a round bat, squarely, yet it seems more confusing than ever. There are certain things however, that will never change, which is the intent of this series of articles. We’ll cut through the confusion to get to the essence of what all the data is actually telling us. Data, after all, is simply the measurements of what happened. Data doesn’t tell us ‘How’ it happened, only ‘That’ it happened. The rest is up to interpretation.
Launch Angle is a great place to start. Ball flight is crucial to truly getting the most out of your swing. Batting Averages are typically well over .600 on line drives, around .240 on grounballs and just over .200 for flyballs, so the trajectory off your bat is sort of a big deal. Analysts speak of Launch Angle as though it’s a verb, like we can turn it on and off or simply “just say no to groundballs”, yet this is a long way from the truth. Hitters can’t really control how the ball comes off the bat. Hitting a round ball with a round bat, only has 3 possible outcomes.
- Near Perfect Contact (20%) – the ball is hit exactly on the same line as the pitch
- Below Center Contact (40%) – the ball is hit below center resulting in some type of flyball
- Above Center Contact (40%) – the ball is hit above center resulting in some type of groundball
Perfect contact is where the sweet spot of the bat hits the ball exactly in the center, sending the ball back in the exact line it came in on . This almost never happens. Most hitters hit the ball at their absolute maximum Exit Velocity less than 5 times in 500 plus at bats. In most cases, like Avisail Garcia one year, hit the highest Exit Velocity that year at 126 MPH. He hit only one other ball that year at 115 MPH or more (only about 91% of his max) and averaged less than 80% of his 126 MPH ‘best bolt’. Top MLB hitters hover around 20-25% Line Drives, with the average about 20%, although only about 1-2% are actually hit perfectly, the rest are all miss hits.
Below Center contact is when the bat is underneath the center of the ball, causing anywhere from a high line drive to a pop up in the infield (when fair) and this miss hit happens roughly 40% of the time.
Above Center contact is when the bat is above the center of the ball, causing a low line drive to a topped dribbler or something in between. This also happens about 40% of the time, despite baseball trying to “just say no to grounballs”. MLB with their efforts to hit the ball in the air, has only managed to change the average from 48% groundballs to 45%. A great improvement, but yet still a very long ways away from 0 groundballs, which is virtually impossible.
The indisputable fact is that round/round collisions have a set of laws that will produce contact at about 40% flyballs, 40% groundballs and about 20% line drives. That 40/40/20 breakdown will always be the standard. The question is what does that mean?
Hitters can’t control Launch Angle, only the things that cause it. In short, creating a Bat Path that matches the Pitch Path is the bottom line. When the bat is in line with the pitch, the hitter has the best chance to produce the most solid contact. When hitters “just swing up” , “swing down on the ball”, or any other swing path choice, they alter the natural ball flight laws.
Just Say No to Groundballs
Warning, this idea gets a bit technical but we will return to simple afterwards. Also, this is not in any way critical of Josh Donaldson, he is truly one of the elite, it is just a great example of how hard controlling Launch Angle is.
In 3 years of fastballs in the center of the zone:
- Josh was thrown 394 fastballs in the middle box of the strike zone.
- He swung at 317 of them with the intent of hitting them all at 25 degrees
- 37% Groundballs – no one can “just say no to groundballs”
- 6% Barrels or balls hit in a Launch Angle range of 25 to 30 degrees at 100 MPH
- His average Exit Velocity was 99 MPH
- Batting Average just north of .400
- 36% of those middle pitches were fouled off
- Swing and Miss rate was just over 11%.
These stats are impressive, but to really understand Launch Angle, you must get precise because perfect contact requires perfect timing in a perfect line and it is quite rare. We must have a single point to measure all contact from if we are to be exact. Only 1 degree line is exact for this middle pitch (assuming they are on the same pitch line which they will not be but will be close), every other one is slightly miss hit. Within a range of 10 degree misses, above or below the exact center, the Exit Velocity will remain close to maximum. 20 degree miss hits start to lose Exit Velocity, a discovery made in the mid 1990’s with my early Exit Velocity testing off the tee.
For the full article on Hacking the Swing: The Cheat Codes of Launch Angle, click here.
Perry Husband is an author, former player, consultant, speaker and one of the nation’s most respected baseball authorities. Husband patented the science of Effective Velocity which has been used by MLB and university coaches, pitchers and hitters in both baseball and softball. He has worked with countless NCAA champions and has been credited for helping the Astros win the National League Championship in 2005.
More information can be found at hittingisaguess.com.

May 17, 2018 | Baseball, Guest Posts, Partners
2017 was most definitely the ‘year of the homerun’. All the experts, the same ones calling for changes in the rules to help the feeble offense of just a couple of years ago, got their wish of more offense. The 2017 HR tally shattered every other year, topping over 6,000. This postseason was no different, with 104 homeruns hit, when it was all said and done. MLB hitters averaged 1.26 HRs per game this past season, setting all kinds of records and yet, the postseason yielded more than double that pace with 2.7 HRs per game. The question is ‘why’ have the homer totals skyrocketed? Is it that the balls/bats/players are juiced? Is it a different mental approach at the plate? Is it different swing mechanics, such as the ‘Launch Angle’ craze? Are hitters ‘getting their foot down earlier’? Are pitchers, even though they are throwing harder than ever, efficient? The truth, as usual in real life, is not so simple that we can answer it with any ‘one’ thing. This is a mechanic’s world, meaning if ‘this’ is wrong then ‘that’ is the fix and the baseball world thinks very much this way.
The baseball world wants to be able to pinpoint the exact reason for the power surge on one facet. The truth is, while the answer is simple, it is not singular. There is not one thing that has changed to cause this phenomenon. The essay on Ev that Carlos did on this subject laid out exactly the ways that hard hit balls are happening.
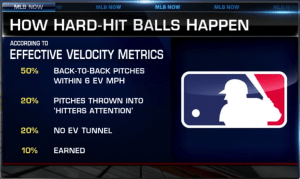
- Timing – pitchers are throwing pitches close in Ev speed, making it easier to time them
- Predictable – pitchers are throwing the most predictable pitch at the most predictable area and at the most predictable speed – Fastball down and away
- No Deception – focusing on down and away fastballs, they can’t hide the identity of off speed pitches and so 20% of the hard contact happens with no Ev Tunnel
- Earned – when pitchers use Ev Tunnels and have at least 6 EvMPH between pitches, their pitches are harder to identify and time up

I have written on the ‘Perfect Storm’ that is happening right now, making the homerun flourish, but this will end sometime soon. When the clues are minimized and deception is at max levels, hitting is going to get very difficult.
I did a very detailed study of this post season, with an especially close look at the World Series. You may have seen some of the results of this study on the latest segment of Carlos’ Tunnel Vision on MLB Now recently. Carlos Pena did an expose on one of the key reasons for the crazy surge in power this postseason. In the debut of Tunnel Vision, Carlos reported the ‘Ev Predictions’ for hard hit balls of the postseason, using the Ev Microscope.
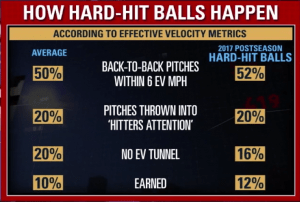
 The Ev prediction was 50/20/20/10 or 50% within 6 EvMPH of the previous pitch, 20% in the Hitter’s Attention zone, 20% with no Ev Tunnel or low deception and only 10% in the ‘earned’ category or Ev efficient sequences. The prediction was eerily accurate, with the totals actually being 52/20/16/12……………
Above is Hits & HRs in the World Series, just a very small percentage away from being EXACTLY on the money. The Ev Microscope never misses by more than a few percentage points because timing is the reason for all hard contact and Ev is the metric for timing.
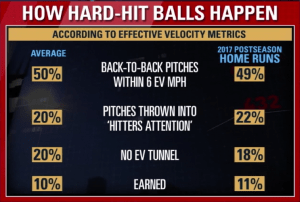
Below – 2017 Postseason homeruns, 104 total. Again, the prediction was almost exactly on the money. How is this possible? The Ev Microscope sees the issue through the lens of ‘Timing’. In other words, when hitters are forced to time pitches on their own, without the inefficient Ev sequences or ‘Gifts’, their hard contact is kept at around 10%. This means that 90% of all hard contact is ‘At Risk’. If I told you that 90% of all running plays in football, based on a new scientific discovery, are inefficient. If ‘ALL’ offenses in football could possibly improve by at least 20% overnight, what do you think would happen? What would that be worth?

- All 9 elimination games were decided on an Ev inefficient sequence
- 33 of the 38 games were decided on an Ev inefficient sequence
Effective Velocity was the single most important factor for teams going home or moving on in the Postseason. 90% of all hard contact could be eliminated, or at least minimized dramatically by maximizing Ev efficiency. Of course, not all 90% of Ev inefficient pitch sequences that result in hard contact will result in outs but you can rest assured, when the timing gifts go away, so will a huge % of hard hit balls. This postseason showed this perfectly. The same exact pitcher/hitter confrontations resulting in devastating homeruns, also resulted in weak to no contact.
George Springer, World Series MVP, went from awful to awesome in one at bat. How is that possible? Ev Efficient Pitch Sequences is one of the major factors in the answer. Not taking anything away from Springer but the HR that sparked his performance in Game 2 of the World Series was an At Risk pitch, back to back 86 EvMPH pitches in the same area. He went off after that and all but 10% of his hard contact, were gifts of this type. 50% of his hard contact was on pitches within 6 EvMPH of the previous pitch and 40% were either in the Hitter’s Attention or easier to identify, due to no Ev Tunnel. This means only 1 in 10 of his hard hit balls were on pitch sequences that were the hardest to time. This was almost exactly the same as all hitters in the postseason, only 12% of hard contact came on the hardest to time sequences.
It is very safe to say that hard contact is all about timing. Hitting is all about timing and this postseason was all about pitchers bending over backwards to help that timing. The hitters still have to execute and they did that beautifully. Their game plans were perfectly matched to many of the pitchers approach. Kershaw has some key weaknesses in his approach that match perfectly with the Astros’ lineup. Kershaw’s Ev mistakes fall into the rhythm of the opponents’ hitters almost perfectly.
What happens when pitchers wake up from the analytics haze that they are in? Hitting will get very difficult for a time. Hitters that are taught to ‘swing up’ or to ‘Launch Angle’ as though it is a verb, will have a very rude awakening. Time Training, the hitting side of Ev, is geared to help hitters understand what is happening and learn to be on time ‘On Purpose’ rather than by accident, as is happening right now. Any method of hitting can work now but that will come to an end when pitchers understand how to max out their pitching approaches.
Perry Husband is an author, former player, consultant, speaker and one of the nation’s most respected baseball authorities. Husband patented the science of Effective Velocity which has been used by MLB and university coaches, pitchers and hitters in both baseball and softball. He has worked with countless NCAA champions and has been credited for helping the Astros win the National League Championship in 2005.
Effective Velocity (EV) is the study of pitch speed and how location changes the reaction time by forcing the hitter to hit the ball at a contact point that is different from what they were ready for.
More information can be found at hittingisaguess.com.


